matrix.rows.levels.map( l => l.sources[0].displayName).join('/')
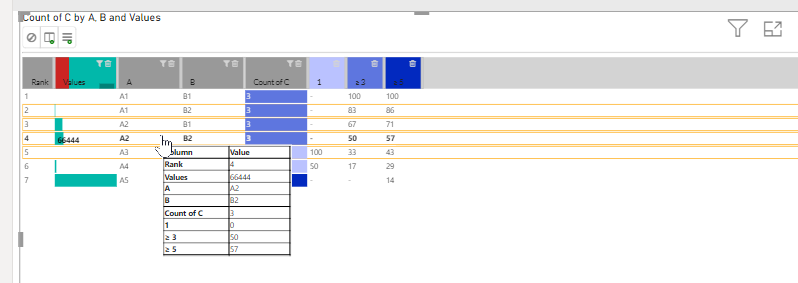
Table Tooltips
Im Repository TableSorter
Useful functions
Calculate Average of Data Points
private calculateAverage(): number {
	if (this.dataPoints.length === 0) {
		return 0;
	}

	let total = 0;
	this.dataPoints.forEach((value: ICustomDataPoint) => {
		total += <number>value.value;
	});

	return total / this.dataPoints.length;
}
To import multiple files from a folder, the following two steps had to be done:
create a list of all files in the folder
for each file: read the file and add it to the result table
When importing files with Power BI, you can do both tasks together or each task separately.
The decision, which way to go, ist done after selection the folder:
You could choose between 4 posibilities. Strictly speaking, you have to possibilities, both with the same to final steps.
Load or Combine files
Load means, the list of the files will be loaded as table Technicaly two things are done:
a connection is created in the model
the data (list of files) is loaded to the mode
Just Load or Transform data
Transform means, you will end up in the Power Query Editor, so you can add additional modifications
In order to better understand the process, we show the two steps separately: one after the other
Load the list of files from folder
Start Power BI and close the start screen, if it is still visible.
Then, click on the Get Data Button in the Home Ribbon
If you click on the small down arrow on the Get Data Button, you have to select the option More
Now, select Folder and click on Connect
Enter the folder (or Browse…) with the files to be loaded and click Ok
After this, Power Query will create a table with all files in the folder.
Now, here is the point to decide, which way to go:
Combine
Read list of files and combine all files into on table
Load
Just keep the list of files and return to Power BI
Transform
Keep the list of files and open the Power Query Editor
We will choose to load the files, because we will do each step later separately
In Power BI Desktop, click on the Data Icon to show the resulting table.
Combine all files into one table
To add additional steps, we need the Power Query Editor.
So click on the 3 dots at the right side of the Query name Samples and choose Edit Query
Now, you are in the Power Query Editor
To combine all files, just click on the small icon beneath the header of the content column:
In the following dialog, you will see all files an a preview of the content for each file. For excel files, you will see the sheet names and the names of the intelligent tables in the sheets.
Click on OK to start the import.
When Power Query is done with this step, you will see the result:
The previous query Samples is still there, but now with the content of all files.
Additionally, you will see four other elements:
How combining the files is done
Each query consists of a list of steps, which are process one after another. Normaly, each step is using the result (data) of the previous step, performs some modifications and has a result (data) for the next step.
So, each step is modifying the whole data of the previous step. Describing some modifications means either
do one thing, e.g. add an additional column
or
do something for each row in the data This means, we need some sort of a loop, like “do xyz for each row in the data
Lets see, how Power Query solves this task.
In the query Samples, exampine the Step Invoke Custom Function1
The Step if performing the M function Table.AddColumn
This functions needs 3 parameter:
table: which is normaly the name of the prevoius step In our example #”Filtered Hidden Files1″
newColumnName: the name for the column to be added “Transform File”
columnGenerator: a function which is called for each row in the input table and creates the new column content each #”Transform File”([Content])
This results in the following procedure:
for each row of the list of files (output from step #”Filtered Hidden Files1″)
get the content of the column Content (this will be the parameter for the function call)
call the function “Transform File”([Content]) to create the column with one parameter: the value of the column ([Content] i
Helper Queries (Required)
This is the required function to create the column content for each file
Helper queries (Optional)
For the resulting query Samples to work, only the function definition is required.
But Power Query add some additional elements, to test the function and show the result
Create a parameter used in the query Transform Sample File and define the curent value Sample File
Define a value for the parameter. Here, the first row in the list of files is used.
Create a query and use an excel workbook as input. The name of the excel file is speficied as a parameter
In this query, the previously create parameter Parameter1 is used as parameter (to much of the word parameter, i know :))
Importing multiple files with different formats
If the selected folder contains files with different format, the result is not what you may be expect:
The list of files contains all files, both csv files and xls files
When combining the files, you can select between the files. So first take a look at an csv file:
The csv file looks as expected:
But the xls files looks strange:
But lets try. Click on ok to combine all files.
But, looking at the resulting query, the data of the xls files still looks strange:
To understand this, take a look into the create transfer function:
The source document (each file in the list of files) is interpreted as csv file.
So, the xls files are also read in as csv files. This leads to the strange result.
You can fix this by adding an additional filter step in the query to select only csv files:
We use cookies on our website to give you the most relevant experience by remembering your preferences and repeat visits. By clicking “Accept All”, you consent to the use of ALL the cookies. However, you may visit "Cookie Settings" to provide a controlled consent.
This website uses cookies to improve your experience while you navigate through the website. Out of these, the cookies that are categorized as necessary are stored on your browser as they are essential for the working of basic functionalities of the website. We also use third-party cookies that help us analyze and understand how you use this website. These cookies will be stored in your browser only with your consent. You also have the option to opt-out of these cookies. But opting out of some of these cookies may affect your browsing experience.
Necessary cookies are absolutely essential for the website to function properly. These cookies ensure basic functionalities and security features of the website, anonymously.
Cookie
Duration
Description
cookielawinfo-checkbox-analytics
11 months
This cookie is set by GDPR Cookie Consent plugin. The cookie is used to store the user consent for the cookies in the category "Analytics".
cookielawinfo-checkbox-functional
11 months
The cookie is set by GDPR cookie consent to record the user consent for the cookies in the category "Functional".
cookielawinfo-checkbox-necessary
11 months
This cookie is set by GDPR Cookie Consent plugin. The cookies is used to store the user consent for the cookies in the category "Necessary".
cookielawinfo-checkbox-others
11 months
This cookie is set by GDPR Cookie Consent plugin. The cookie is used to store the user consent for the cookies in the category "Other.
cookielawinfo-checkbox-performance
11 months
This cookie is set by GDPR Cookie Consent plugin. The cookie is used to store the user consent for the cookies in the category "Performance".
viewed_cookie_policy
11 months
The cookie is set by the GDPR Cookie Consent plugin and is used to store whether or not user has consented to the use of cookies. It does not store any personal data.
Functional cookies help to perform certain functionalities like sharing the content of the website on social media platforms, collect feedbacks, and other third-party features.
Performance cookies are used to understand and analyze the key performance indexes of the website which helps in delivering a better user experience for the visitors.
Analytical cookies are used to understand how visitors interact with the website. These cookies help provide information on metrics the number of visitors, bounce rate, traffic source, etc.
Advertisement cookies are used to provide visitors with relevant ads and marketing campaigns. These cookies track visitors across websites and collect information to provide customized ads.