
Power BI Visuals | Cookbook
Inhaltsverzeichnis
Installation
Install NodeJS
Install pbiviz
npm i -g powerbi-visuals-tools@latest
Calculating of Data
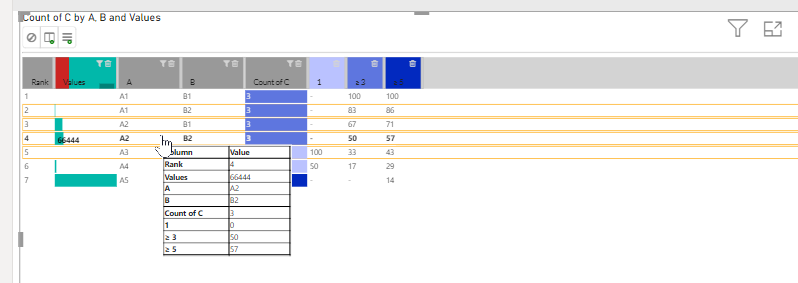
Working with Highlighted values (“supportsHighlight”: true)
sumOfValues     = Object.keys(node.values).map(key => +node.values[key].value).reduce((prev, curr) => prev + curr)
sumOfHighlights = Object.keys(node.values).map(key => node.values[key].highlight ? +node.values[key].highlight : null).reduce((prev, curr) => curr ? prev + curr : null)
Get all Level Names
matrix.rows.levels.map( l => l.sources[0].displayName).join('/')Table Tooltips
Im Repository TableSorter
Useful functions
Calculate Average of Data Points
private calculateAverage(): number {
	if (this.dataPoints.length === 0) {
		return 0;
	}

	let total = 0;
	this.dataPoints.forEach((value: ICustomDataPoint) => {
		total += <number>value.value;
	});

	return total / this.dataPoints.length;
}
capabilities.json
Alignment
        "alignment": {
          "type": {
            "formatting": {
              "alignment": true
            }
          },
          "displayName": "Horizontal Alignment"
        },
Leave a Reply